


Turning complex market data into clear visual insight

Too busy mopping turn off the taps
I’m drawn to brand and marketing problems that create inconsistency, slow teams down and weaken recognition.
This project solved one of those problems from the inside. We understood the pain firsthand, so the focus became building a system that made work faster to produce, easier to scale and consistently on-brand.
Project timeline: 48 hour Hackathon
The Problem
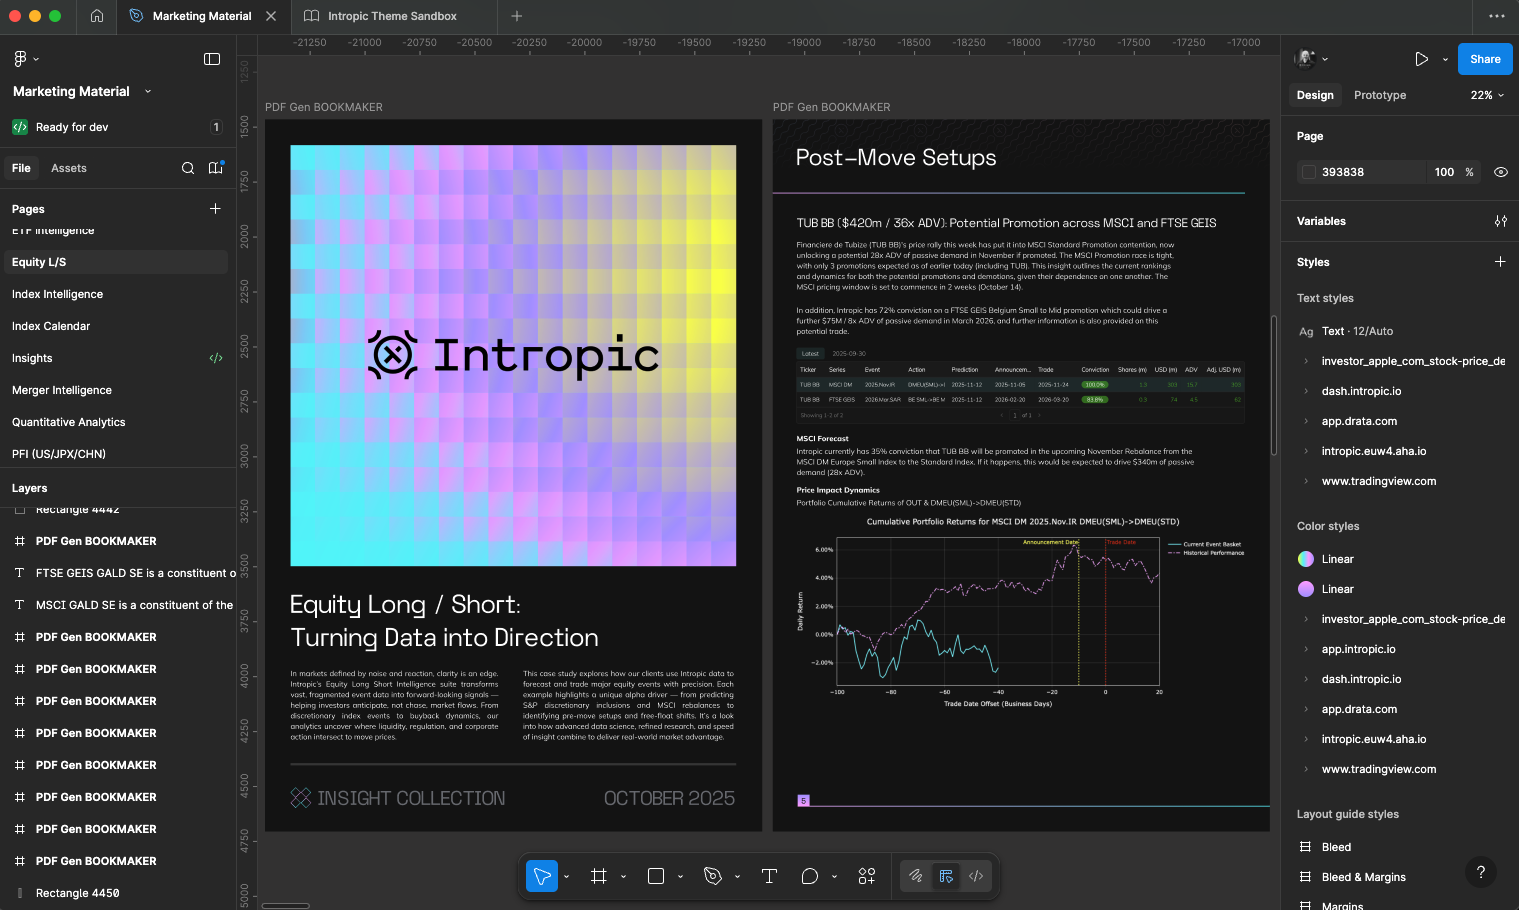
During periods of intense market activity, research and quant teams needed a steady stream of bespoke, on-brand financial charts. Each variation required new benchmarks, timeframes, or annotations, forcing design to repeatedly start from scratch. The result was high-effort, repetitive work and increased dependency on design precisely when speed and clarity mattered most, it was a structural, not skills-based, problem.
The solution
Chart Editor is a highly flexible, intuitive platform that makes financial data publication-ready by default. It brings global markets into a single, unbiased workspace, with powerful click-and-drag editing and annotation tools that enable teams to create on-brand charts at speed, without relying on design.
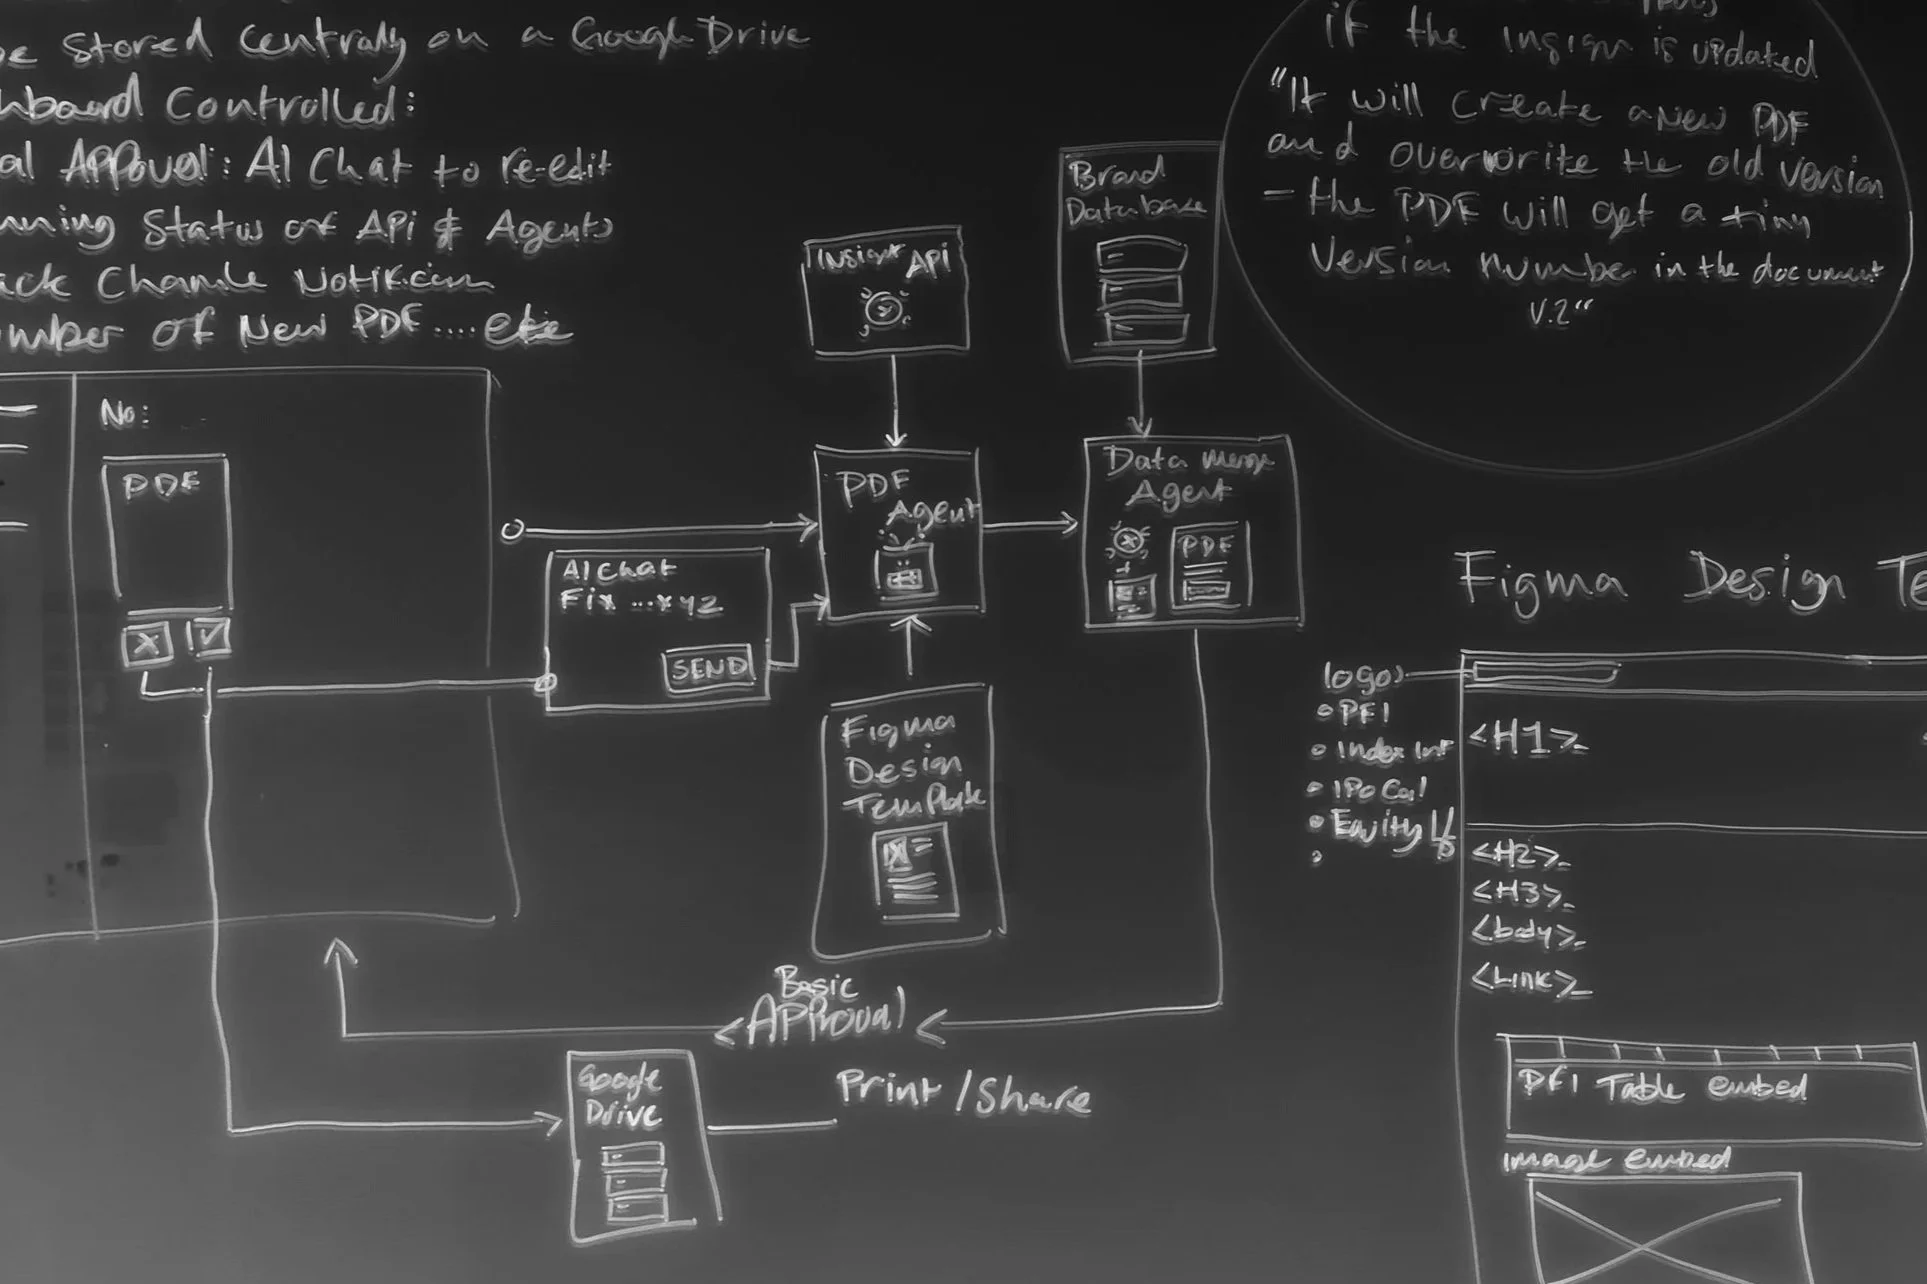
Crucially, the use case was defined early. That clarity shaped the product architecture, allowing data logic, flexibility, and design quality to be built in from the start, rather than layered on later.

From architecture to basic build
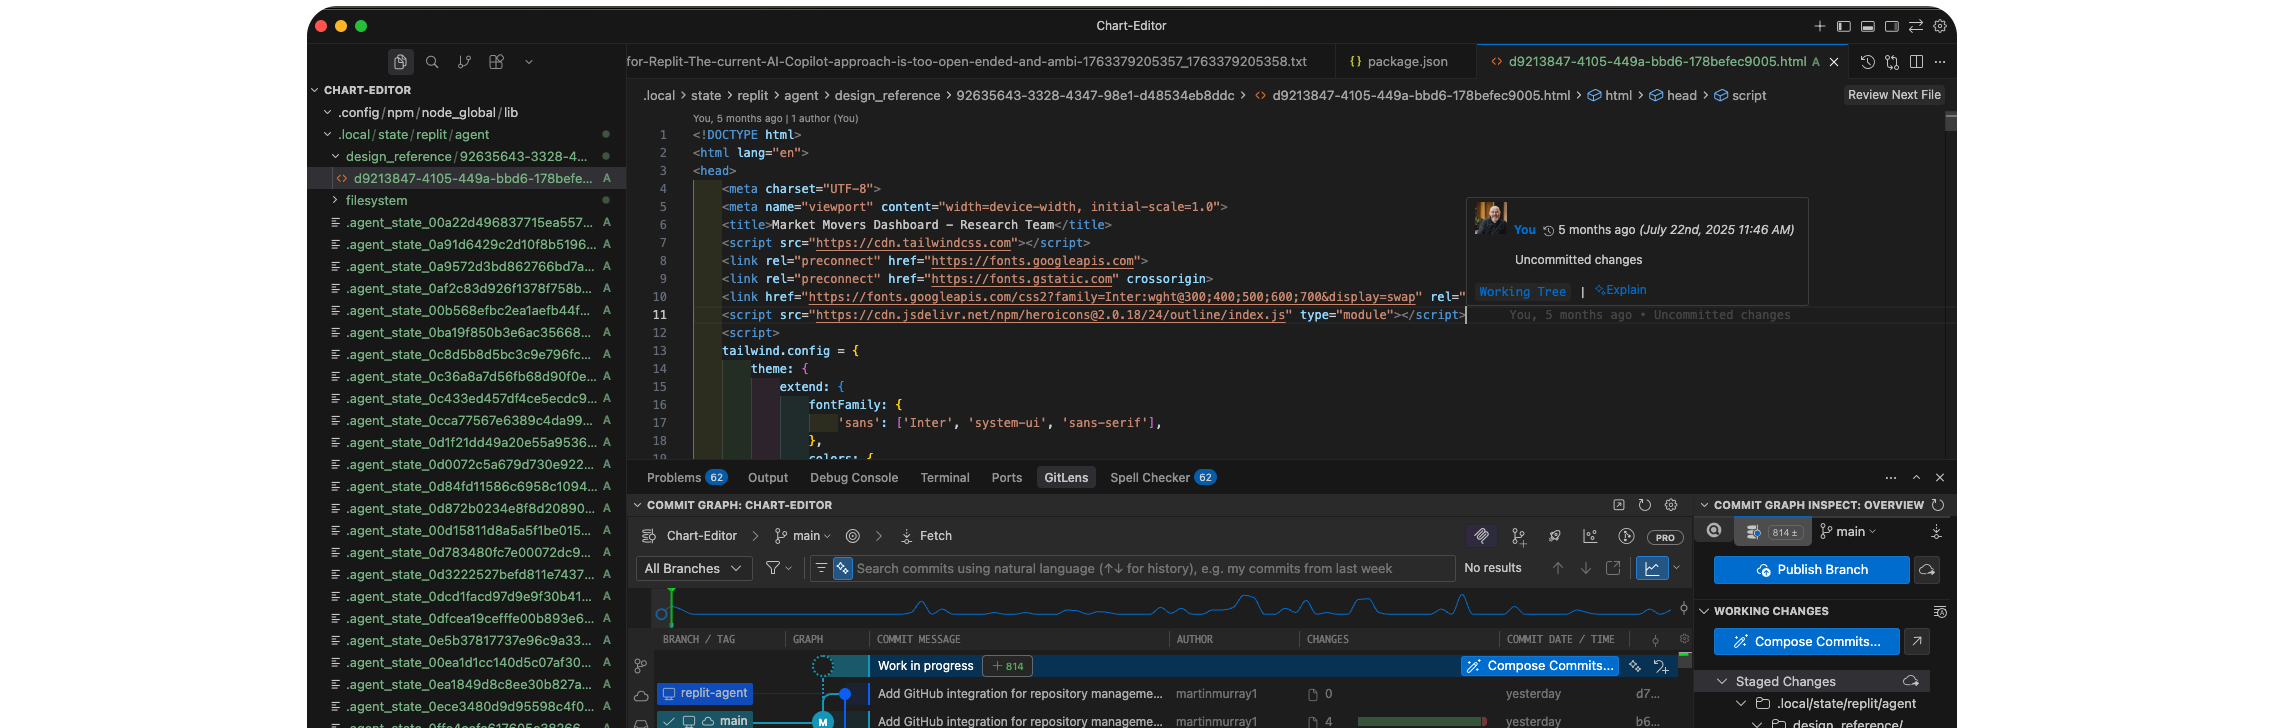
Once the user flow and product architecture were clearly defined, I moved quickly into building. Rather than starting from scratch, we pulled from our existing AI-driven component library to establish consistent patterns and accelerate development. Using GitHub for version control and collaboration, alongside Cursor for AI-assisted development, allowed us to iterate rapidly while keeping design intent and implementation tightly aligned.

Plugging in the design system
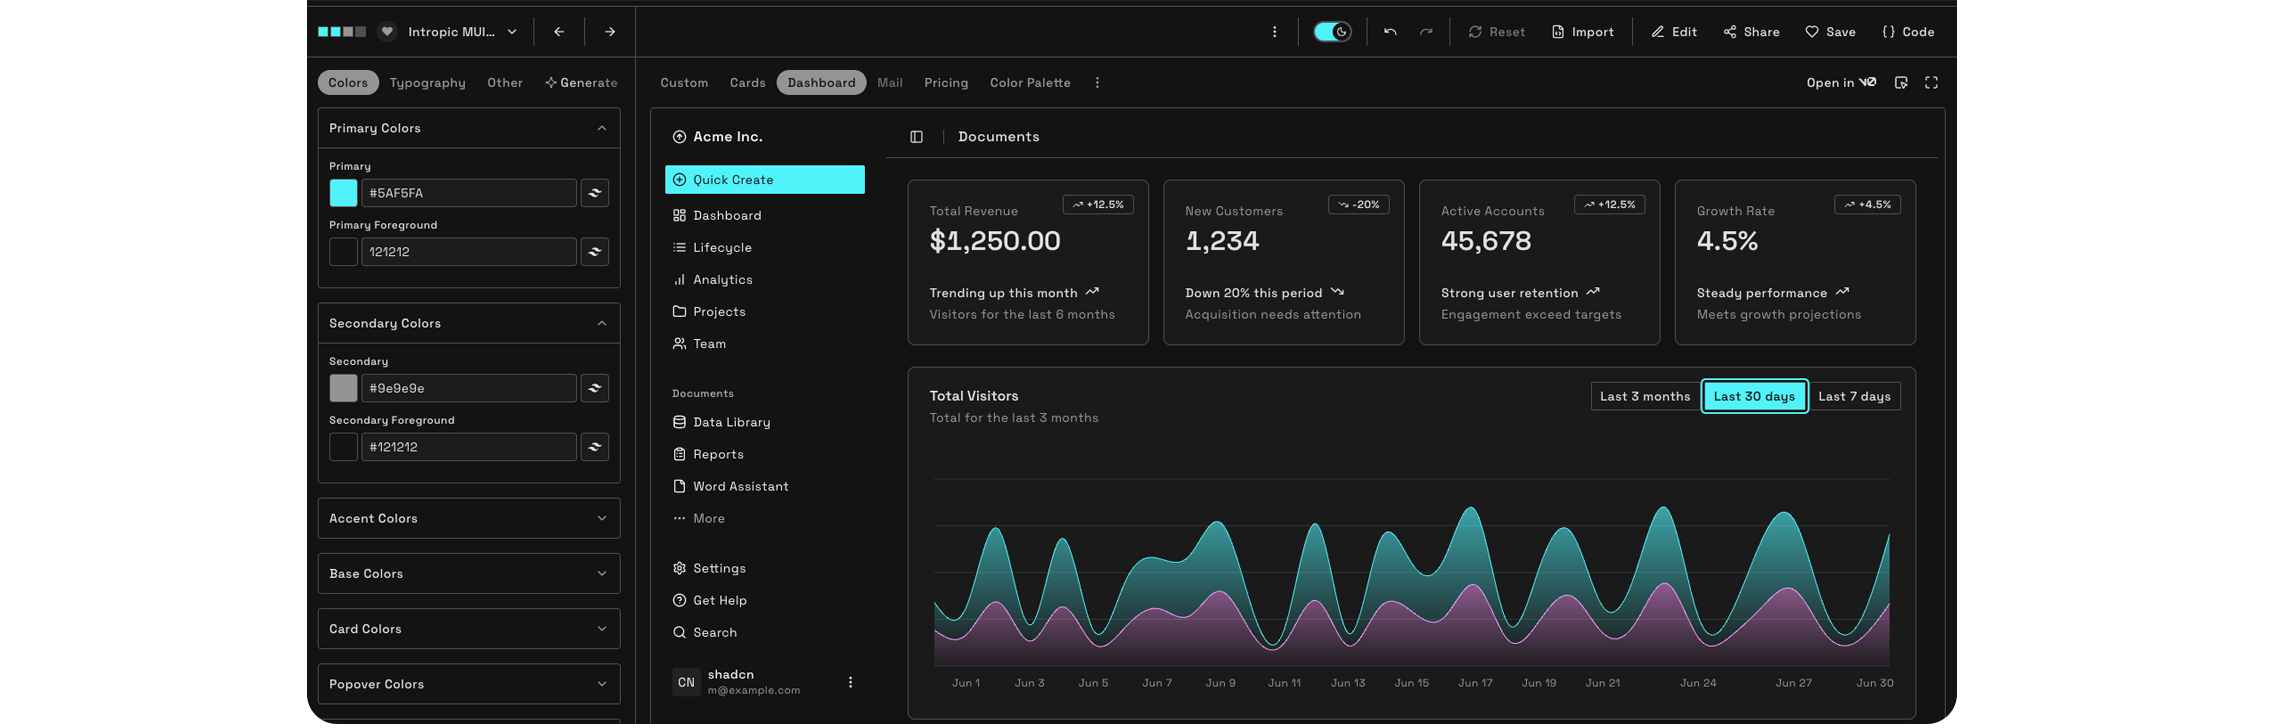
To move quickly without sacrificing quality, we plugged in our lightweight Figma / TweakCN design system tailored to Intropic’s visual language. By cloning the system directly from Figma and translating it into a flexible CSS foundation, we avoided recreating styles by hand. TweakCN proved the perfect layer for AI-assisted UI/UX building — lightweight, predictable, and well suited to Copilot-style workflows.
The Results & Outcome
What began as a lightweight hackathon prototype evolved through a few focused iterations into a formidable product — with clear potential as a public, revenue-generating offering. The system has saved hundreds of design hours, transformed how research teams think visually about their insights, and improved retention and reading rates for cliometrics. Just as importantly, it has brought a consistent, elevated brand look and feel to all Intropic content and insights, strengthening recognition and trust.
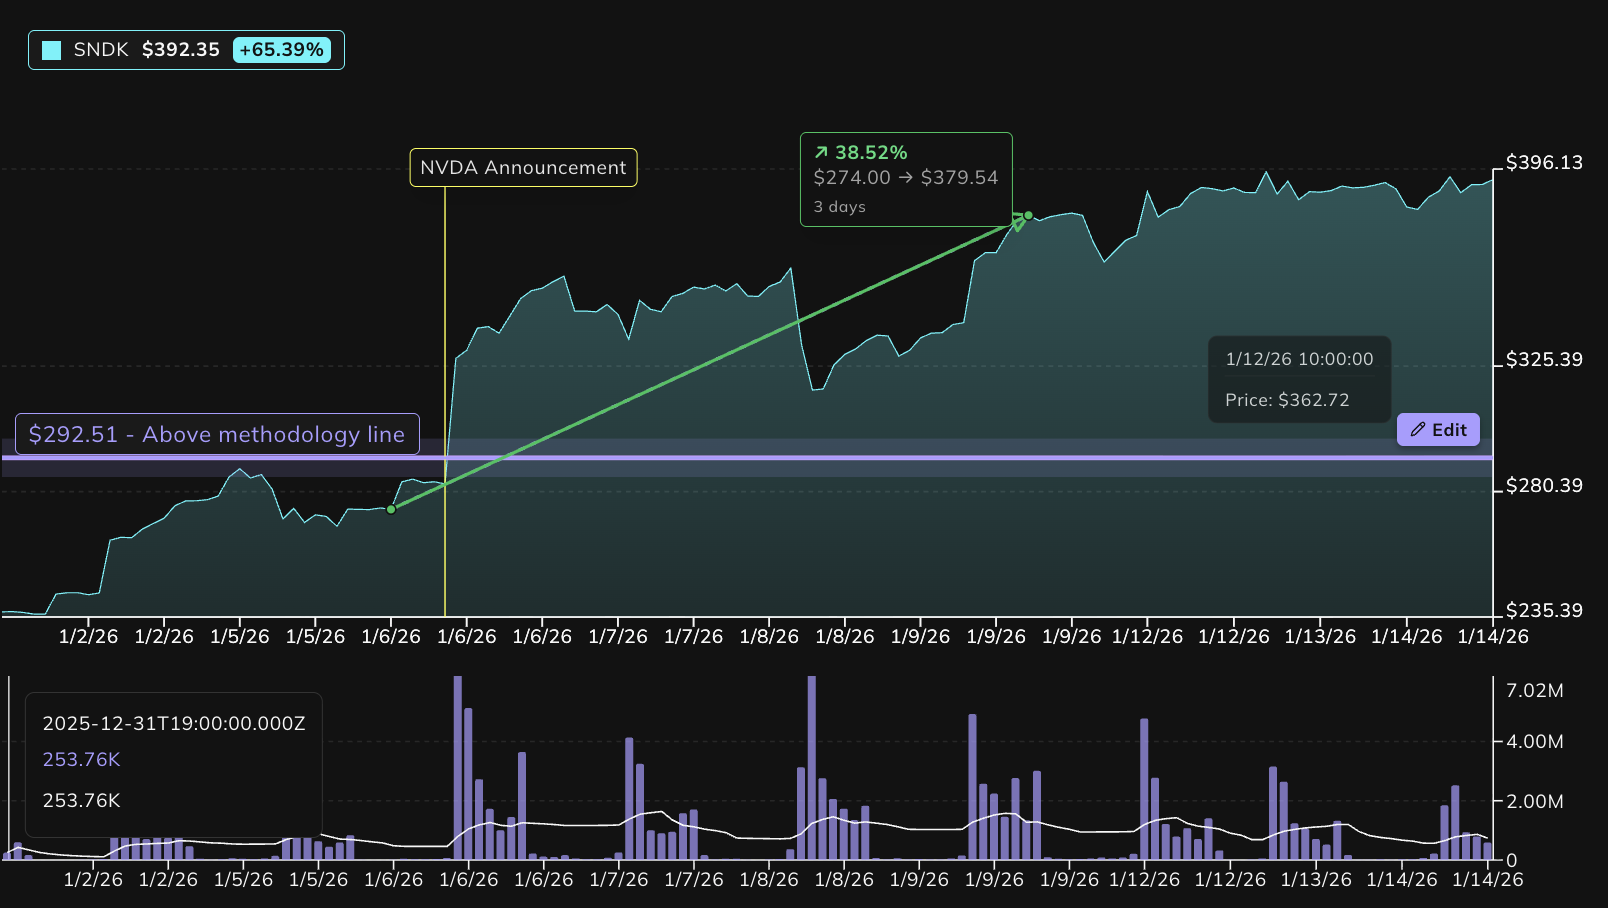
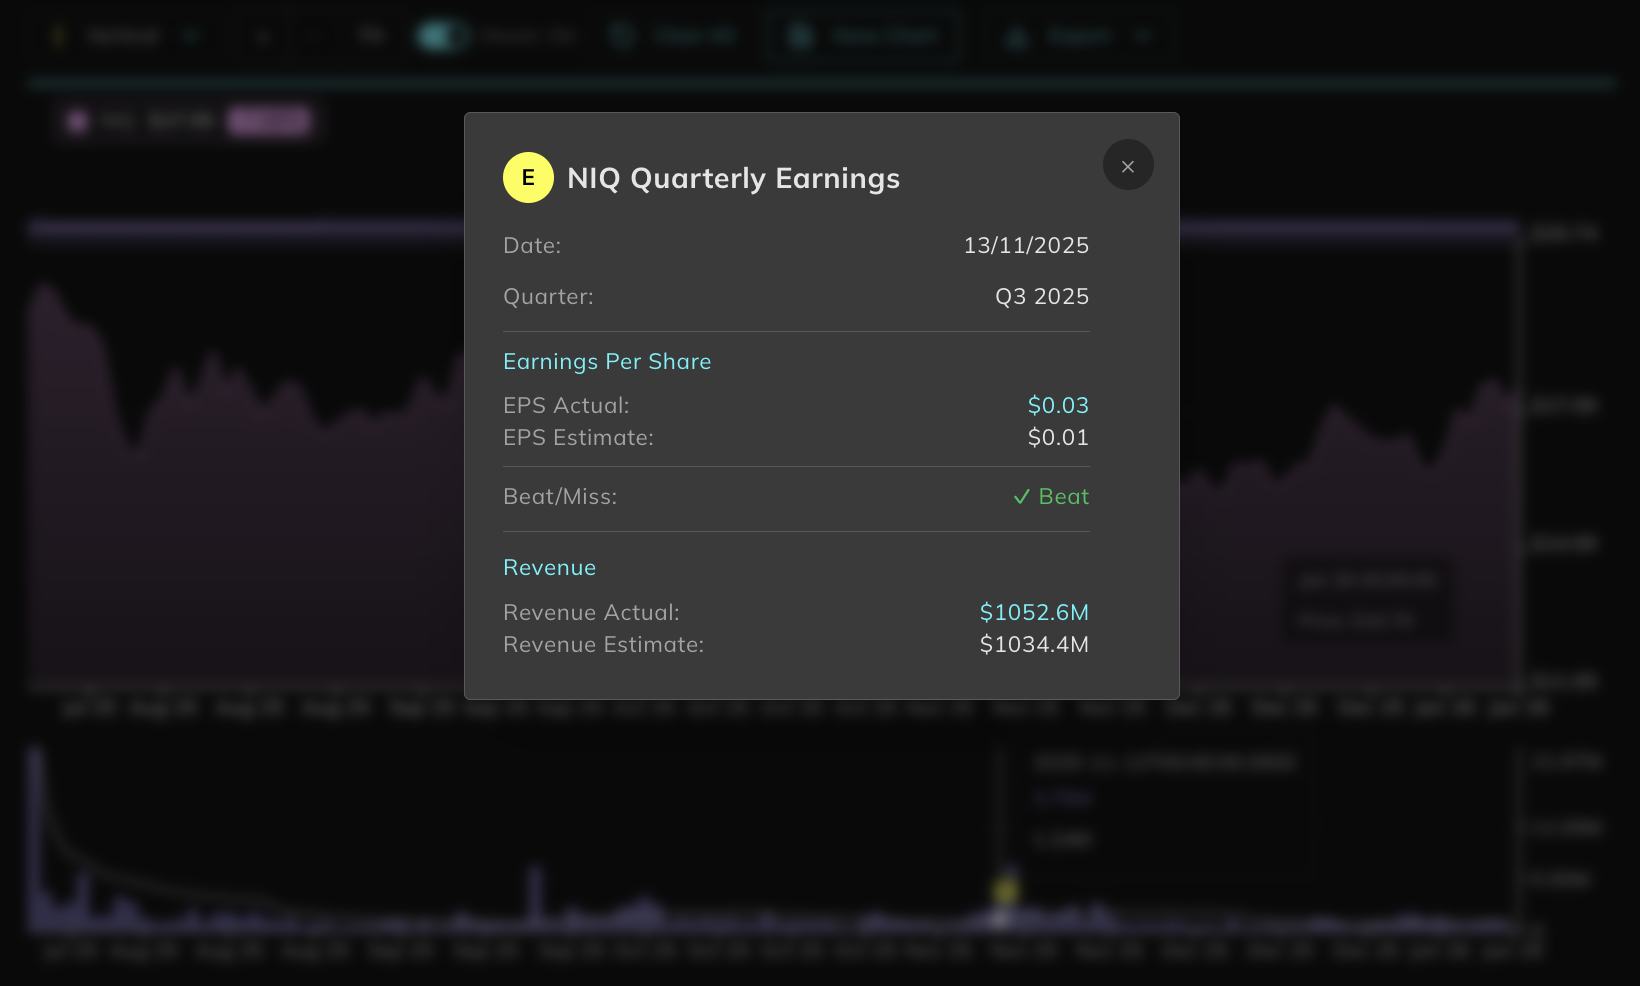
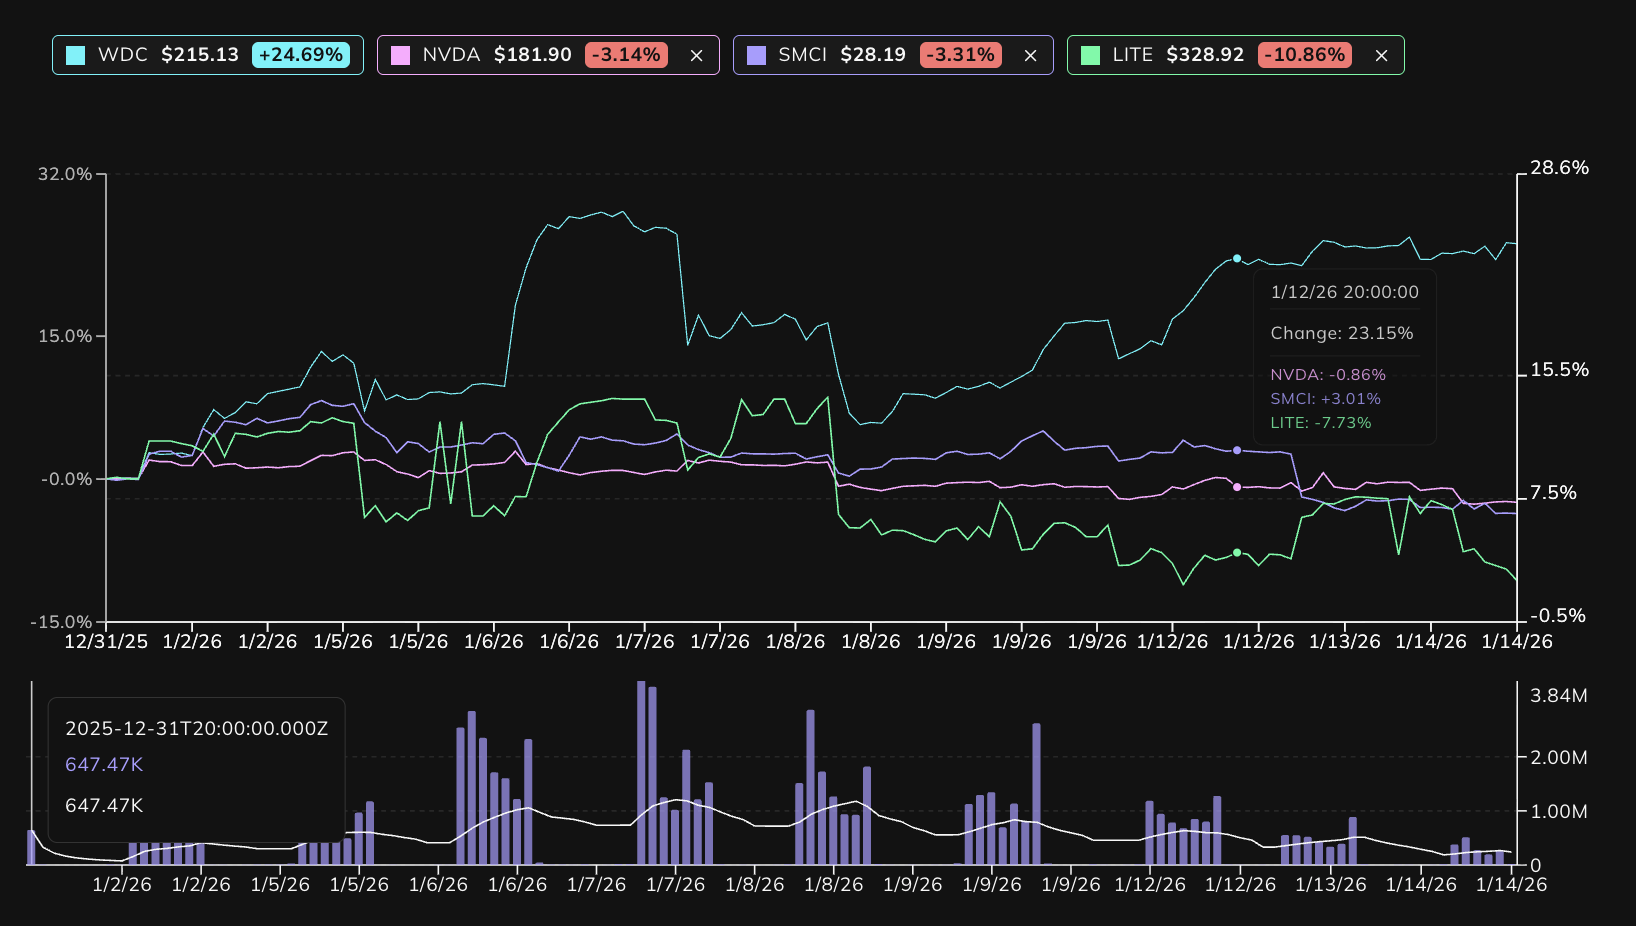
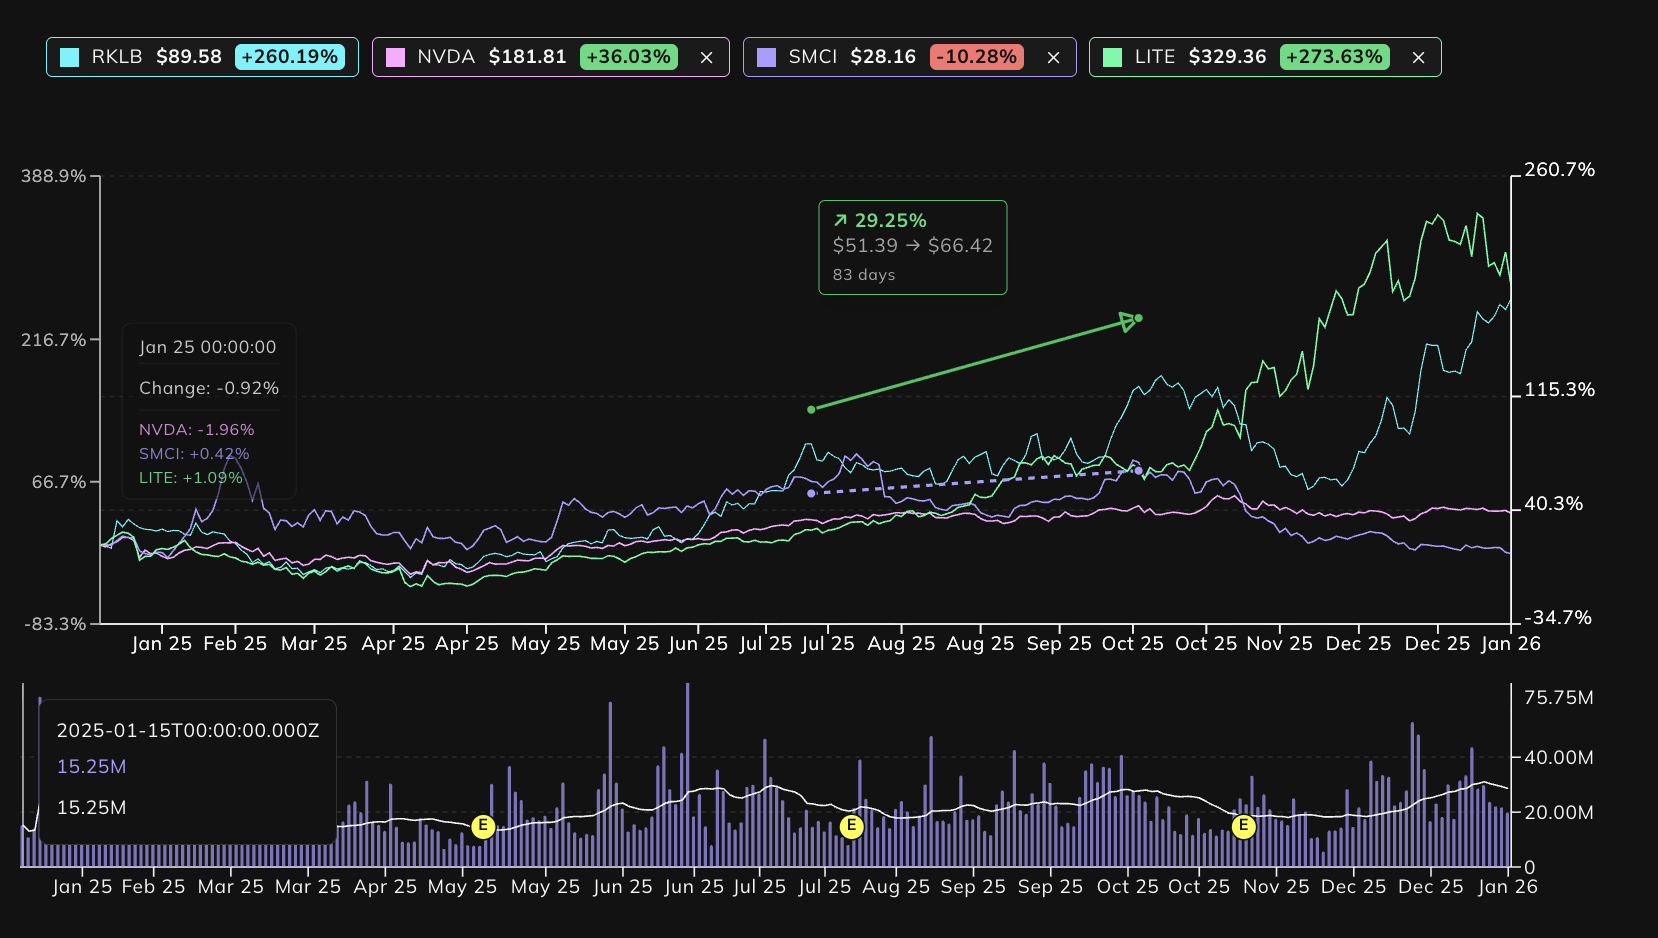

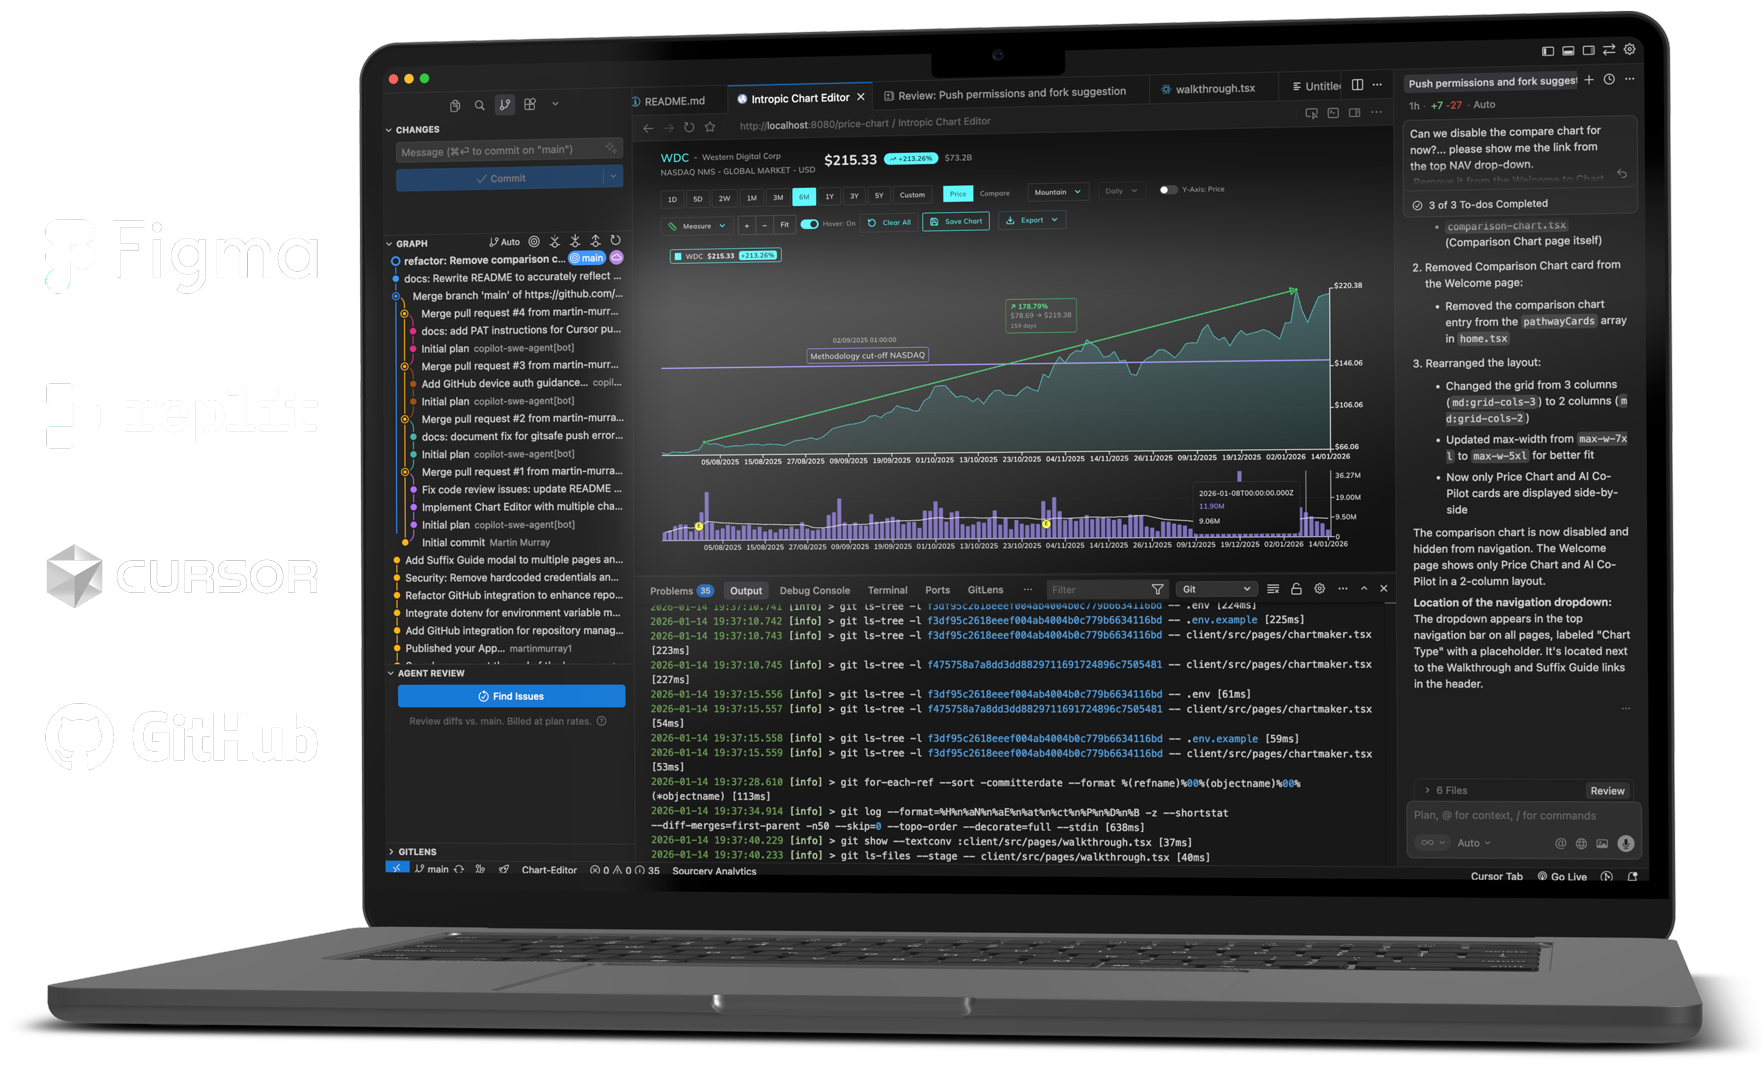
Product features
-
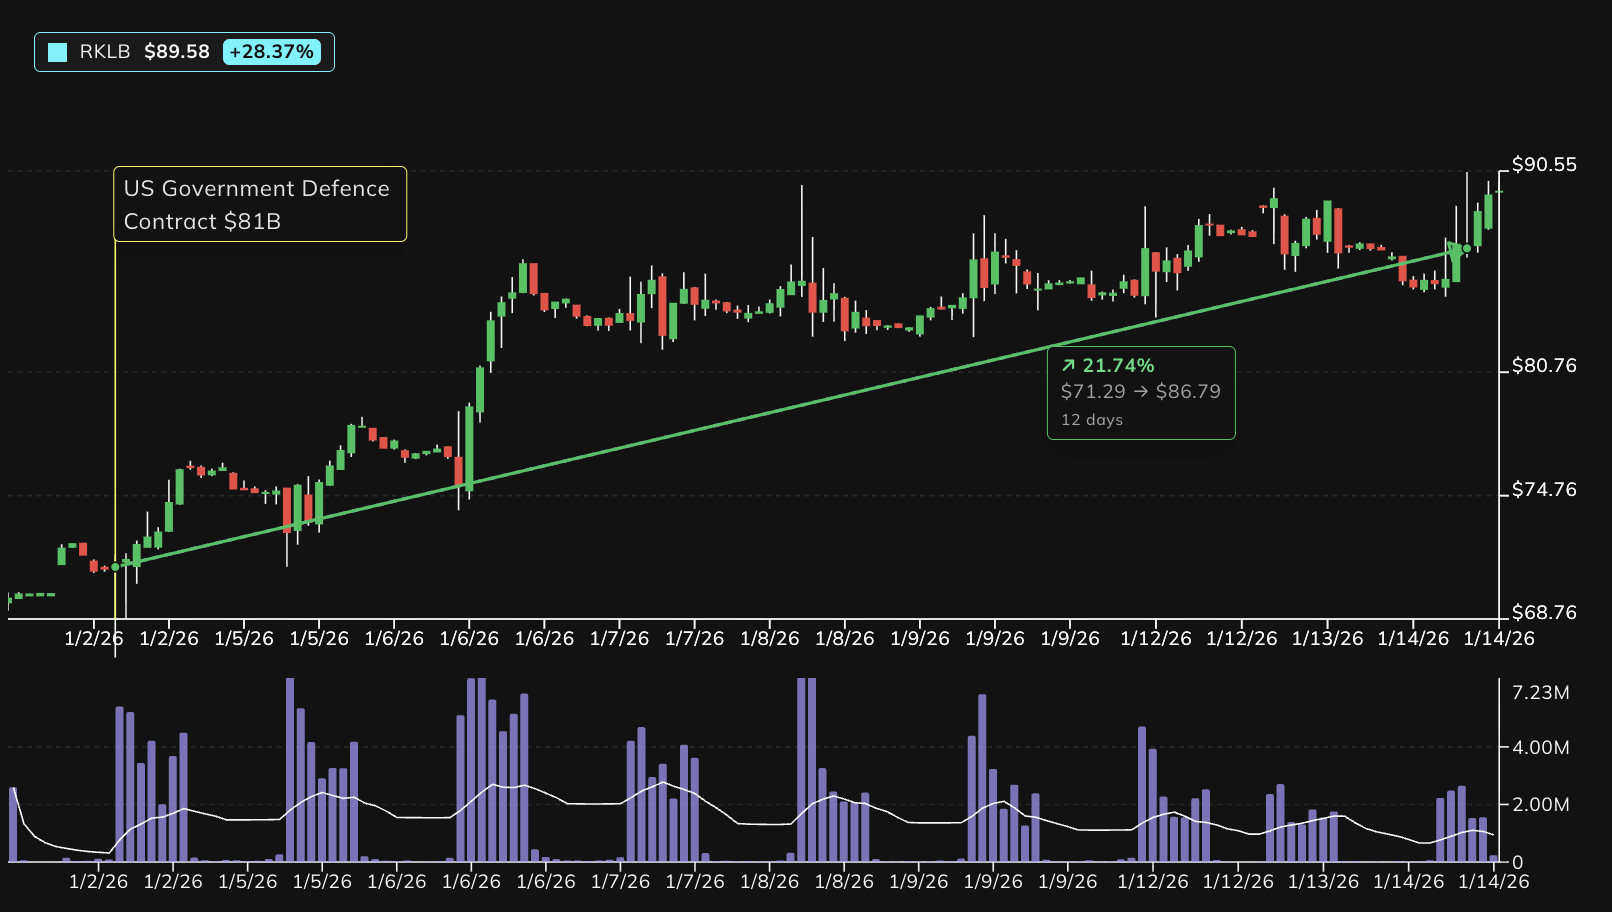
This charting system is built to reflect how markets actually move — across time, assets, and geographies. From intraday price action to multi-year trends, every chart adapts fluidly to your chosen timeframe, interval, and perspective. Switch seamlessly between absolute price and relative performance, zoom effortlessly, and read exact values in real time. Nothing is fixed. Everything responds.
-
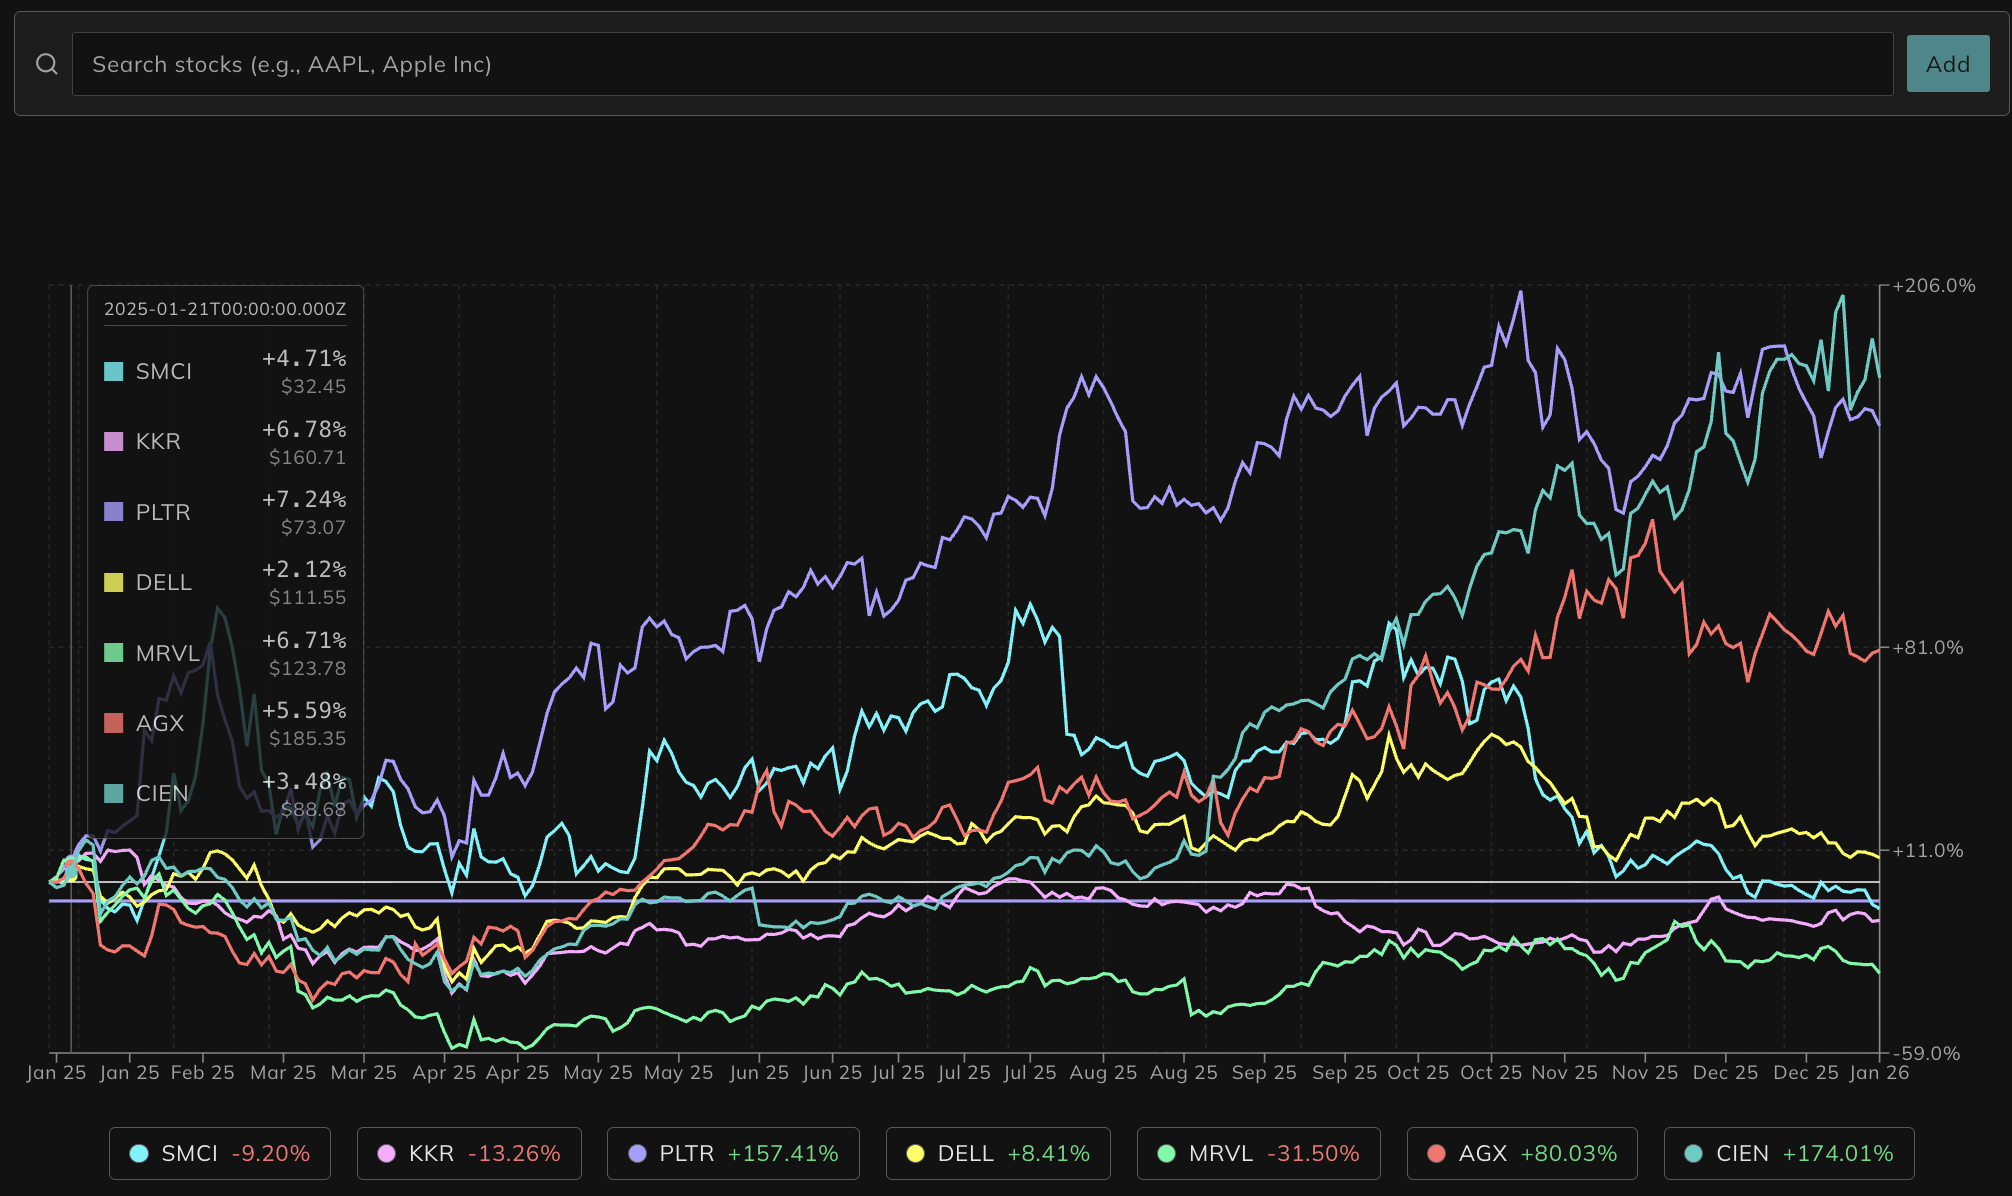
Markets don’t exist in isolation. Compare up to twelve instruments side by side, normalized automatically so meaning isn’t lost to scale. Cross borders, exchanges, and time zones without friction, equities, indices, and global markets aligned into a single, continuous story. The result isn’t just comparison, it’s clarity.
-
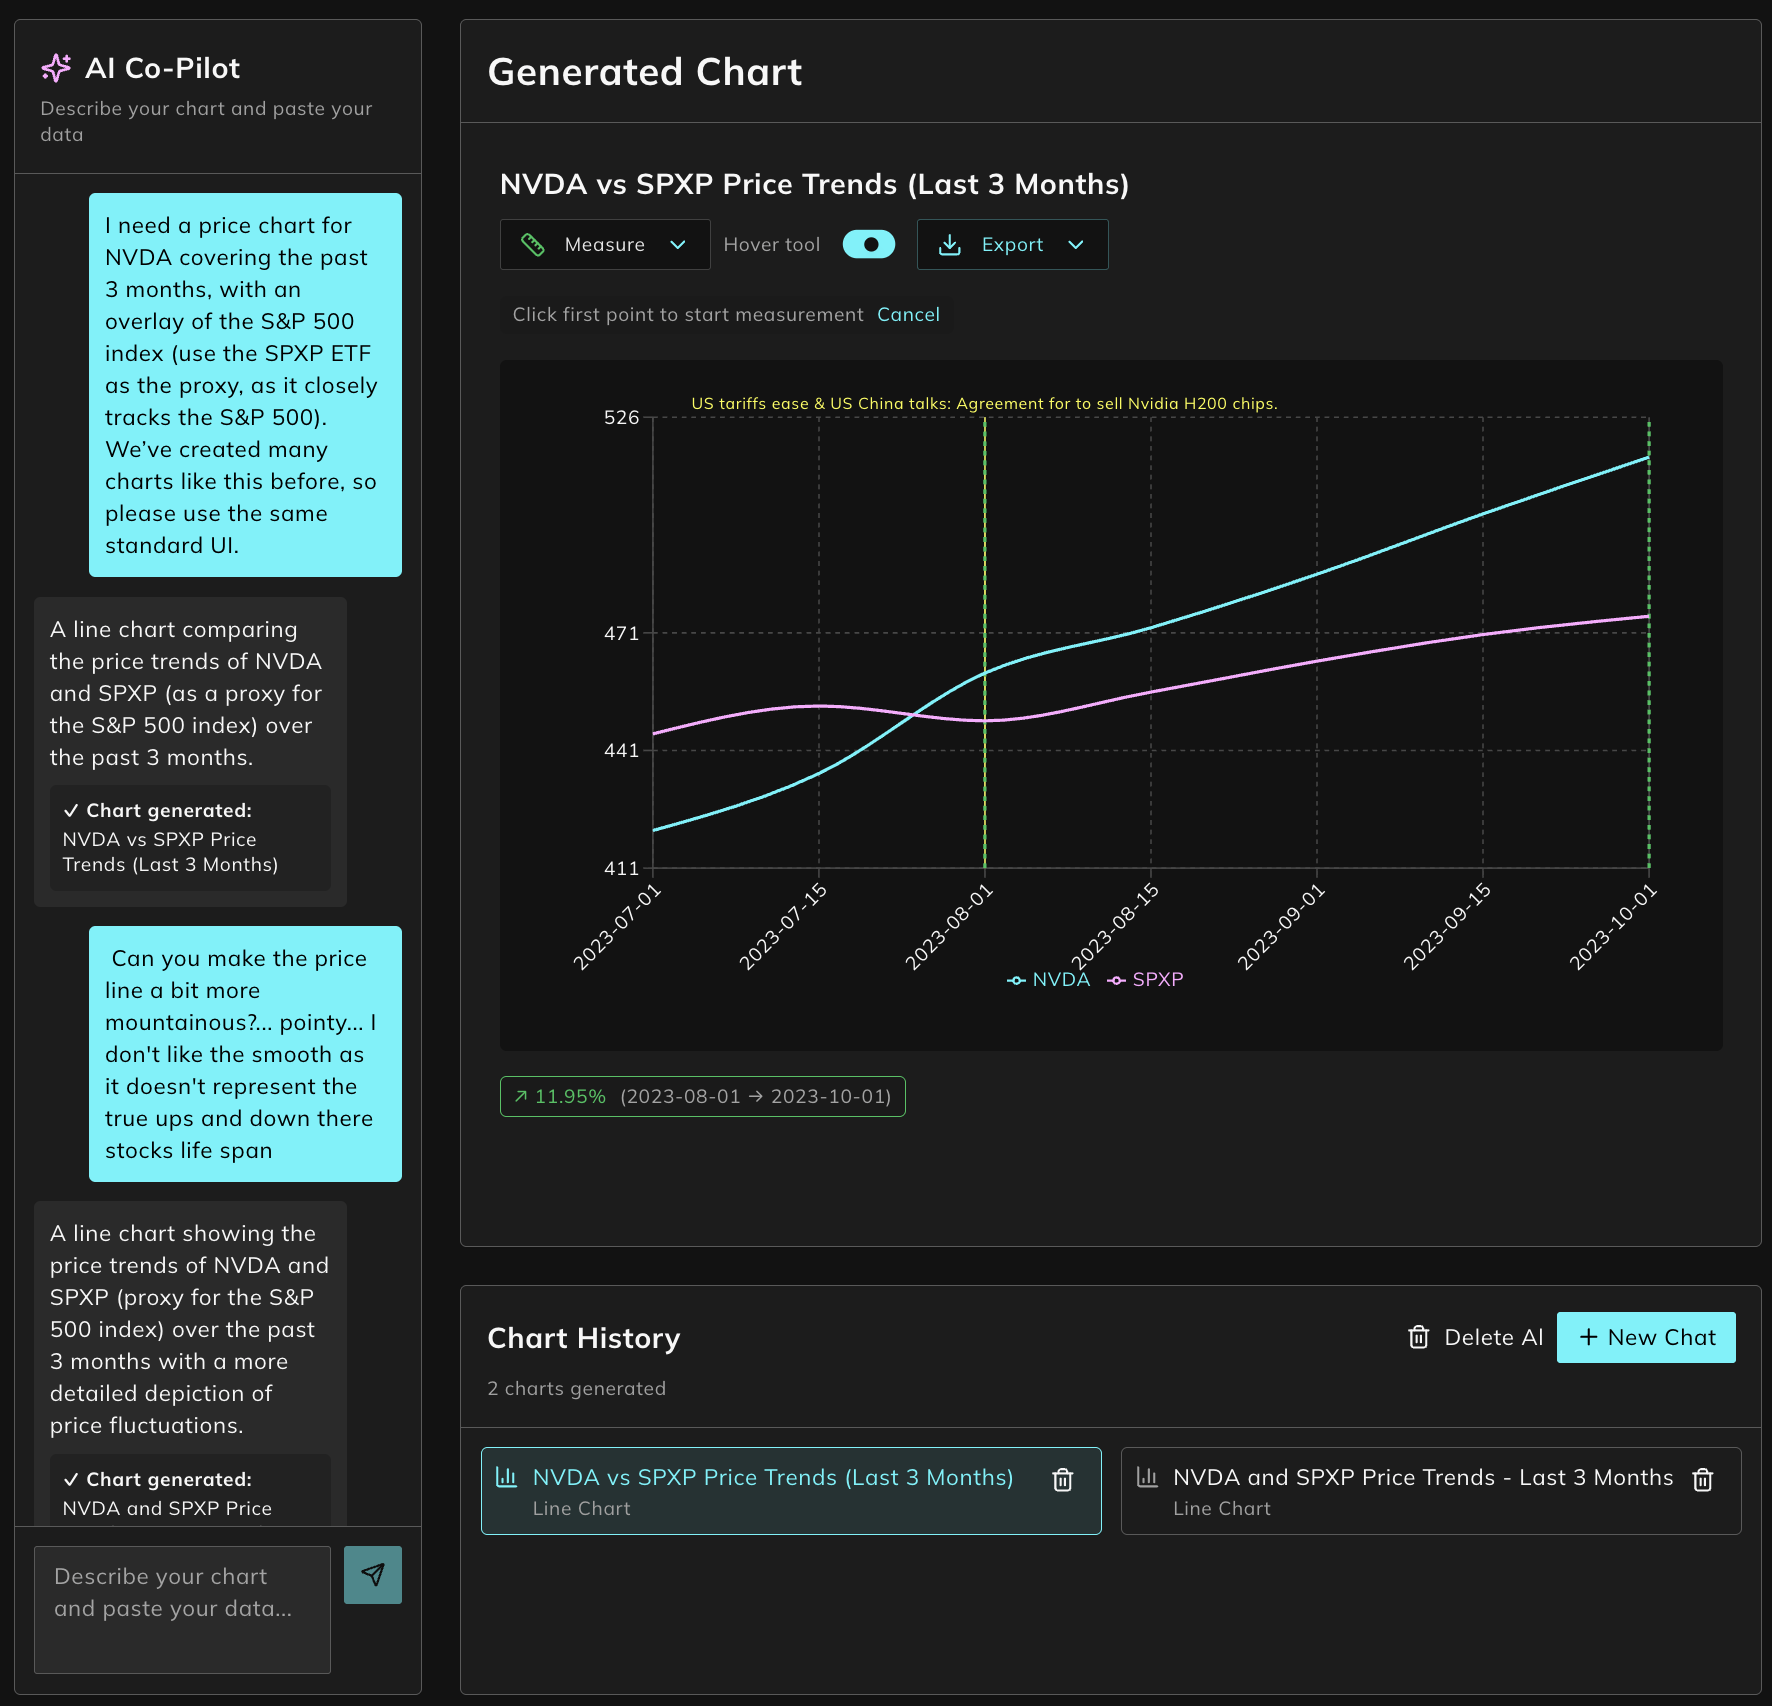
Charts no longer start with controls — they start with intent. Describe what you want to see, upload your own data, or reshape a view mid-conversation. The AI co-pilot translates natural language into structure, suggests annotations, and remembers context across a session. Analysis becomes collaborative, not mechanical.
-
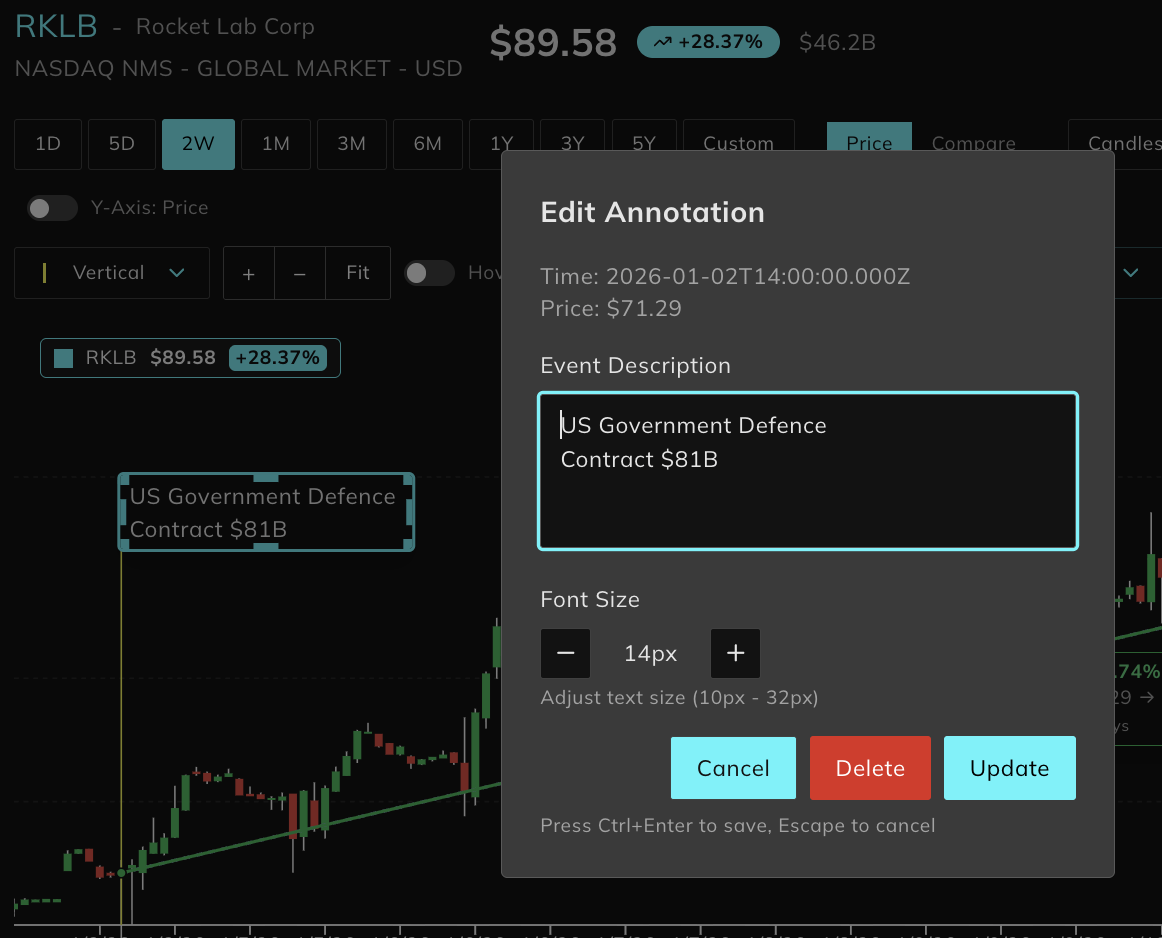
Annotations are first-class citizens. Mark levels, measure movements, capture insights, and layer commentary directly onto price action. Everything is precise, editable, and persistent — from draggable notes to percentage measurements and per-ticker memory. Charts don’t just show data; they preserve thinking.
-
Every chart can be saved, restored, duplicated, exported, or embedded — fully intact. From Bloomberg-style global coverage to CSV overlays and publication-ready exports, the system is designed to travel wherever insight is needed. Secure by default, consistent by design, and always ready to pick up where you left off.